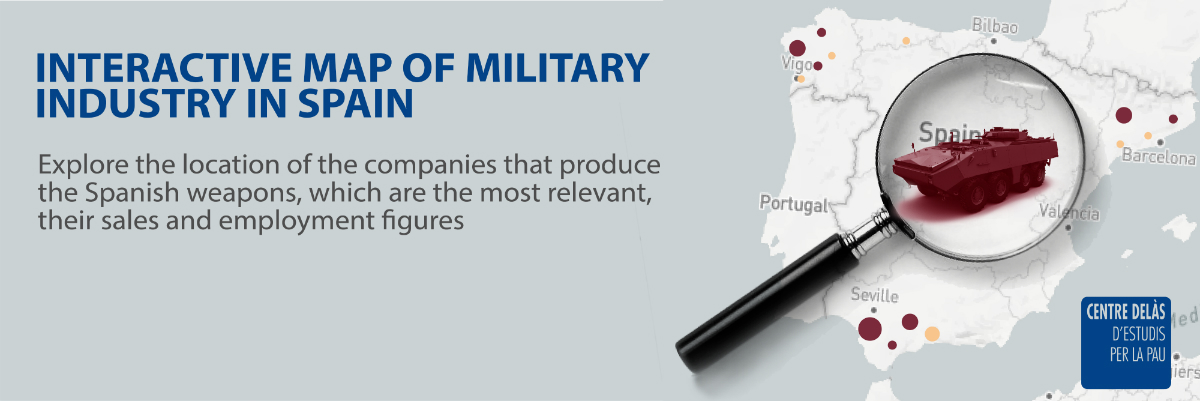

The objective of this interactive map is to visualize the companies that manufacture weapons, materials or components of weapons, and services that are supplied to the Spanish Ministry of Defense or destined for export. In this map only the most relevant companies that we find in Spain are shown.
The Spanish Ministry of Defense has about 500 companies supplying goods and services. This map shows the most important companies of military production, considering weapons, goods and services that perform a military function; while all that provide domestic services (catering, cleaning, energy, etc.) have been discarded. Discrimination has been applied according to military billing, showing only those companies that show sales of more than one million euros per year, which are marked in red. The rest of companies are shown in yellow and are of less relevance.
THE DATA
The map shows, in a given period (one or several years), the companies with production in the defense industry (yellow) and the companies with a defense production considered relevant (red). The data visualization incorporates the name of the company, a brief description of the type of production in the field of defense, and its location. At the same time, it is also possible to visualize by Autonomous Community, showing which companies are present in each territory. The sales and employment figures -total and in defense - of the company in the selected period are presented. The data can be viewed in a table, graphic and map format, and are downloadable in each of these formats.
HOW TO USE THE DISPLAY OF DATA:
To use the map, you can indicate the name of the military company in the search engine or select the Autonomous Community, and consult the data of the predetermined period between 2003 and 2015, or you can select the specific period or year that you want to consult. The map also lets you navigate without selecting a specific company or Autonomous Community, which allows you to see all of the companies located on the map.
Steps to follow for a correct visualization:
1st: Select the company in the search engine, enter its name or move the cursor directly on the map. You can also start by selecting an Autonomous Community in the search engine on the right.
2nd: Take into account the different types of companies (yellow or red marker).
3rd: Choose a year or a complete period with the cursor below the map.
4th: The results will appear with different graphics or numerical representation:
- Maps showing the main military companies and their sales and employment figures, located by location.
- Graphs integrating the variables studied: the results of both total and defense sales, and the total employment and defense data of the companies with relevant production.
- Data (values) of sale (euros) and employment (persons) of the companies for selected period, downloadable in CSV and HTML format.
With the support of:


 Graduated in Business Administration and Management, she has worked as an administration and project manager in several organisations.


